How to Use Dashboards
The How to Use Dashboards video explains how to navigate and use basic Tableau dashboard features. Users will learn how to filter data to limit the data displayed and how to download this data in image (.png), Acrobat (.pdf) and PowerPoint (.pptx) formats.
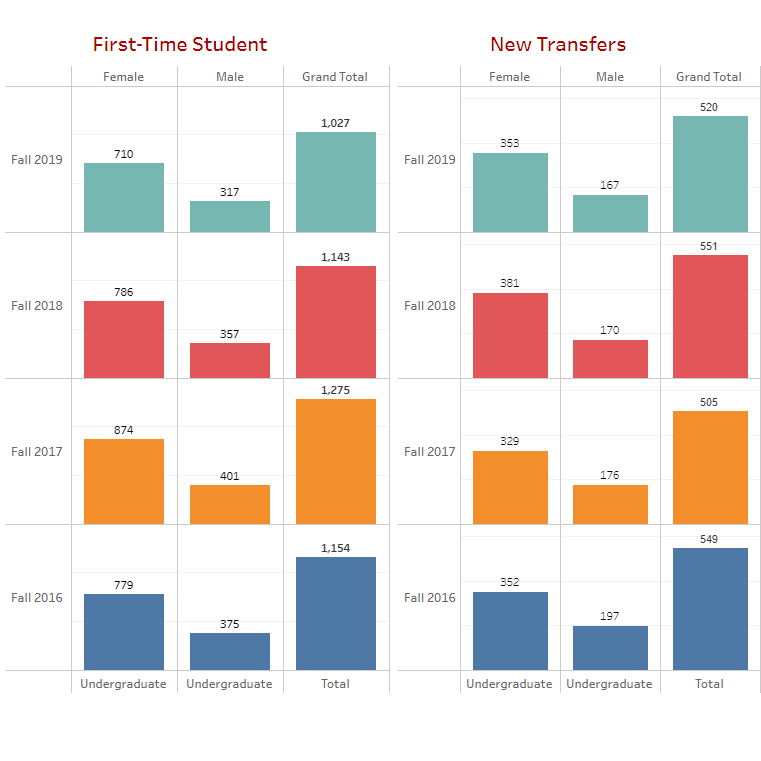 This dashboard displays undergraduate and graduate student admission information, including the number of first-time and transfer students admitted, SAT and ACT scores, high school class rank and GPA, ethnicity, residency, and transfer student totals by state and institution.
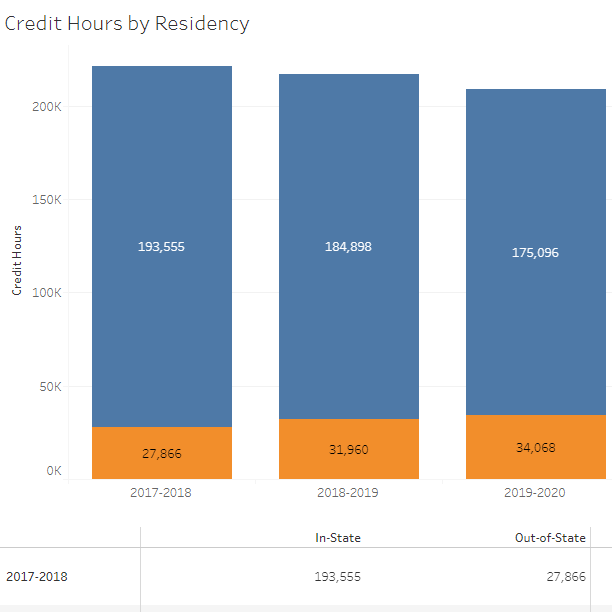 The Credit Hours dashboard includes detailed student credit hours by college and school, by career level, by class method of delivery and instruction, by residency, and by intersession and other variables. Student credit hours correspond to the number of enrolled credits at the time of the census.
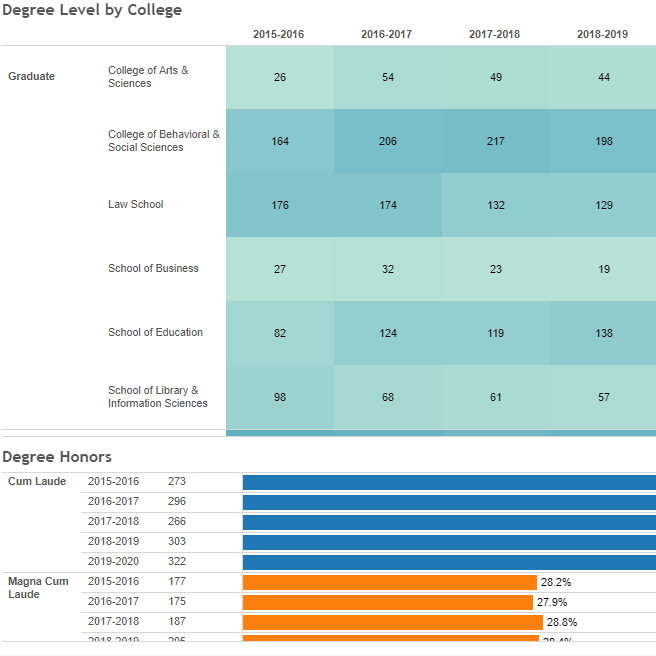 This dashboard displays information concerning degrees awarded by college, program, demographic, degree level and other degree-related information.
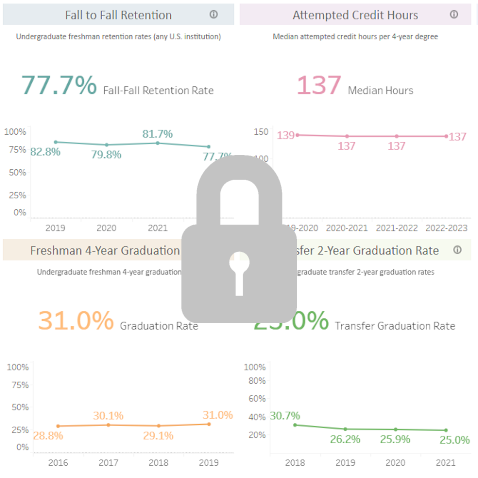 This dashboard provides information about performance on core metrics that have been chosen to reflect the long-term vision and priorities of the Board of Governors of the University of North Carolina System. These metrics have been identified as being integral to institutional success and have funding implications for NCCU. Access requires that you have an Insight account and either be on the NCCU network or connected to the NCCU VPN. Contact OIRA if you are unable to access it.
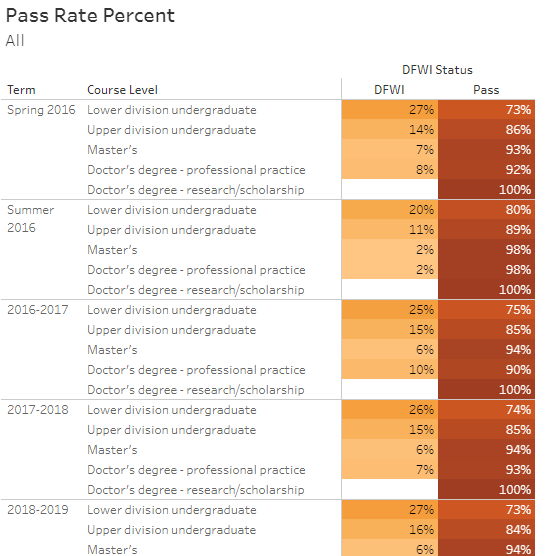 This dashboard displays information concerning undergraduate and graduate student pass rates at the college level. Grades D, F, W, and I have been used to assess student performance and retention in courses with high withdrawal and failure rates.
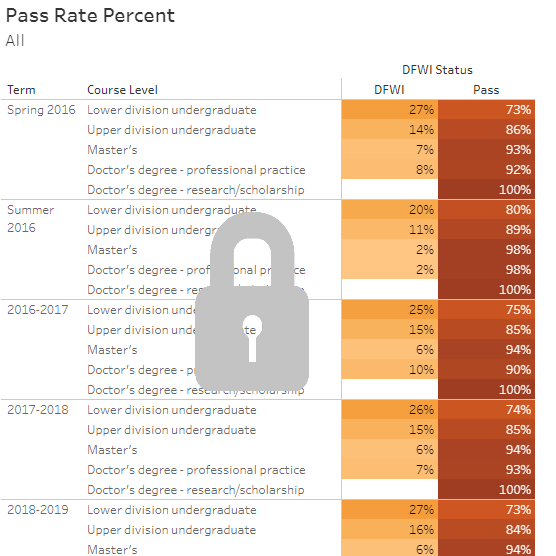 This dashboard displays information concerning undergraduate and graduate student pass rates at the college level. Grades D, F, W, and I have been used to assess student performance and retention in courses with high withdrawal and failure rates. Access requires that you have an Insight account and either be on the NCCU network or connected to the NCCU VPN. Contact OIRA if you are unable to access it.
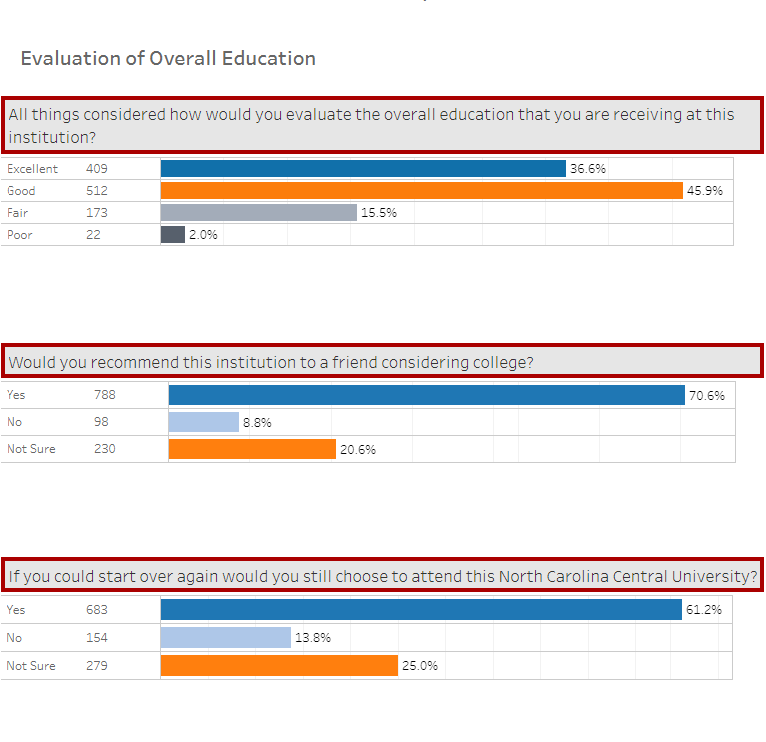 The Graduating Senior Survey dashboard provides insight into exiting graduating seniors' overall satisfaction on the following: faculty contributions to their educational experience, academic and non-academic support services, knowledge, skills and development, and educational experiences. The survey results can be used to assist campus partners in evaluating student success outcomes.
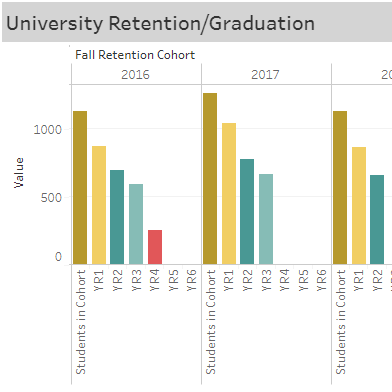 This dashboard displays undergraduate retention rates. The retention rate is the percentage of full-time, first-time bachelor's (or equivalent) degree-seeking undergraduates from the previous fall (cohort) who are again enrolled in the current fall within the institution.
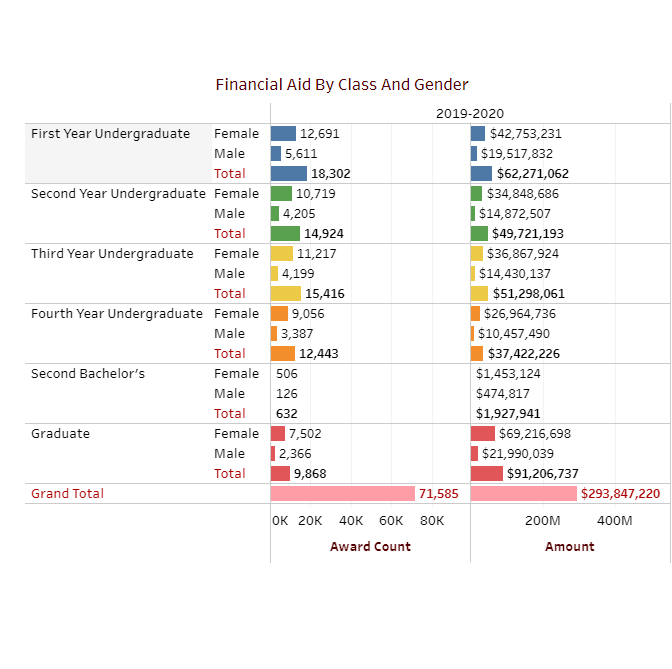 The Financial Aid dashboard contains NCCU financial aid awards by various types, including awards by source, by award type, by class, and by gender. The dashboard also contains financial aid awards by both source and type.
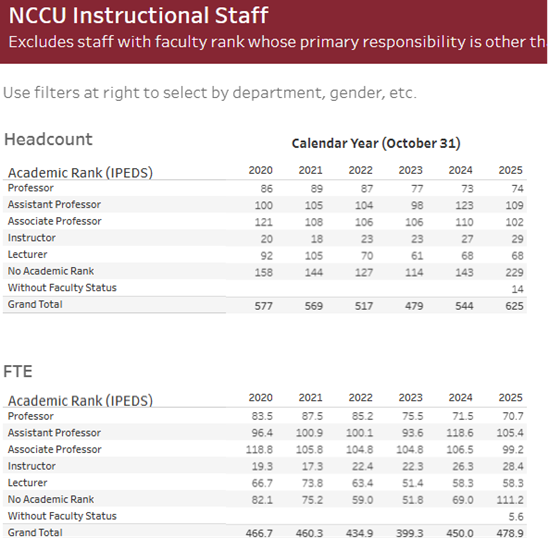 This dashboard displays employee headcount and full-time equivalent (FTE) information.
 This dashboard displays NCCU summary finance information. The summary information includes but is not limited to expenses and revenue for areas such as academic support, instruction, student services, research and wages. Access requires that you have an Insight account and either be on the NCCU network or connected to the NCCU VPN. Contact OIRA if you are unable to access it.